Showing posts with label job satisfaction. Show all posts

Thursday, September 1, 2016

Trends in Job Satisfaction

Much of my work is aimed at helping people find satisfying jobs. That’s why I was interested to find a survey report (PDFhere) that looked at job satisfaction, among other fulfilling aspects of life. The report, “Trends in Psychological Well-Being, 1972–2014,” by Tom W. Smith, Jaesok Son, and Benjamin Schapiro, was published by the research institute NORC at the University of Chicago. (I earned my master’s degree there, but at that time I was researching English literature.)

The researchers looked at surveys that have measured people’s level of satisfaction in general, with one’s marriage, with one’s financial situation, with the level of excitement, and (most interesting to me) with one’s job. Specifically, they looked for trends in how people’s satisfaction changed over the past four decades.

It turns out that of all the kinds of satisfaction that they looked at, job satisfaction was the most stable over the time period that they examined. Here is a graph showing the trend for those reporting they were “very satisfied” with their job or housework:


Note the contrast with this graph of satisfaction with one’s financial situation—which shows a long-term decline and a notable dip apparently caused by the Great Recession:


In addition to the trends, note the levels of satisfaction shown here. At its very peak, in the late 1970s, financial satisfaction reached only 35 percent, whereas job satisfaction came close to 90 percent at times and never sank below 80 percent.

Using data from the report, I created the following graph showing trends in job satisfaction separately for men and women. You can see that the general trend is that women used to be less satisfied than men but lately have been more satisfied. My guess is that this is the result of growing opportunities for women in the workplace:


The researchers found that job satisfaction tends to increase with age; this was true for all years that they studied. It seems likely that as people age, they gain greater mastery over their job demands, they may get greater recognition for their skills, and they may learn which job environments suit them best and thus move into more satisfying situations. Here is a graph based on the average percentages of those “very satisfied” over the entire span of the study:

Finally, here are the trends for job satisfaction, with separate trend lines based on the level of education of the respondent: less than high school, high school, or college (or beyond).

Overall, those with more education tend to be more satisfied with their jobs. A notable exception occurs just at the beginning of this century, when those with less than high school showed the greatest satisfaction—evidently the result of the tail end of the tech boom. Conversely, the Great Recession seems to have dampened, at least temporarily, the satisfaction of those with more education.

Monday, June 20, 2016

A Three-Angle View on Your Career

When you think about how to improve your career, it helps to view it from several different angles. I find it useful to employ the approach called tagmemics. Please let me define this term for you before it scares you away, and then you’ll start to see its usefulness.

The idea of tagmemics is that any unit of human experience can be viewed in three forms: as a particle, as a wave, and as a field. This approach was originated by a linguist, Kenneth Pike, so it may or may not be very sound as physics, but I find it very useful for achieving insights into ideas such as the one I’m discussing here: improving your career.

First, let’s look at your career as a particle—as a static entity. To do that, you need to move away from the word career (which implies development over time) and focus instead on the word job. (If you’re still in school, consider that your job.) Ask yourself these questions about your job as it is right now:

  • Does your job have a title that you’re happy with?
  • During the workday, do you find the work tasks interesting and engaging, or do they involve knowledge or tasks that don’t interest you?
  • Are your skills a good match for the job, or do you feel overwhelmed (or unchallenged)?
  • Is the stress level one that is comfortable to you?
  • Are you satisfied with the physical requirements of your job?
  • Is the amount of structure in your job too loose or too confining?
  • Do you enjoy the level of creativity in your work?
  • At the end of a typical workday, do you have a feeling of satisfaction?
  • Do you have a way of assessing your work and therefore taking pride in what you have accomplished?
  • When you’re not working, is your job providing a sufficiently comfortable lifestyle and amount of leisure?
If some of your answers indicate a situation that is not totally satisfactory, this may be an indication that you need to make some changes to your job. But first, you need to consider the wave and field perspectives on your career.

Your career is a wave in that it is a dynamic process. It is unfolding over time; it has a past and a future. Here are some questions that reflect on this dynamic nature:

  • Over the course of time—whether it’s a day or a year of work—does your job offer a level of variety in tasks, locations, or people that you find satisfactory?
  • Do you make career choices by planning, by seizing opportunities, or by following the path of least resistance?
  • Are your past career preparation and experiences a good match for your present job, or would they be a better match for something else?
  • Does your job provide opportunities for advancement?
  • Are you knowledgeable about future developments in your career field and the job opportunities (or threats to job security) that they will create?
  • What have you done or are willing to do to prepare for these job opportunities or to counteract any threats?
  • Will your career allow you to deal adequately with future changes in your lifestyle, such as marriage, child-rearing, or retirement?
  • If you’re still in school, will you be able to get through the program?
Your answers to this second set of questions (wave-based) may help you plan for ways to remedy shortcomings revealed by your answers to the first set (particle-based). But you should also consider the field aspect of your career, which has implications for both your current situation and your plans.

Your career is a field in that it involves relationships. It occurs in a spatial and interpersonal context. Answer these questions:

  • Is your job allowing you to live in a community that satisfies you?
  • How do you feel about your workday commute and the amount of travel?
  • Do you enjoy the physical setting of your work?
  • How comfortable are you with your boss, your co-workers, and members of the public whom you deal with?
  • Are you satisfied with the job’s ratio of solitary work to working with or dealing with other people?
  • Do you desire more or fewer opportunities for leadership in your job?
  • Are you knowledgeable about your industry, not just your job?
  • Do you have credentials that have value in your industry (or another industry)?
  • Are you known to people in your industry (or another industry) and, if not, do you know how to make yourself known?
  • Do you feel good about the extent to which your work contributes to the well-being of other people, of animals, or of the natural environment?
  • Do you worry about the possible impact of an on-the-job error on your organization or on other people?
  • Does your work create stress between you and your family or community?
  • Are you satisfied with the level of prestige that your work confers on you?
If you have read this far, I hope that you understand that you usually need to consider all three aspects of your career to solve any problems that you have detected in it. For example, if your work is too stressful (a particle issue), you need to think about what is causing this stress. It might be another particle issue, such as the necessity of following a restrictive rulebook, but it could also be a wave issue, such as a feeling of being in a dead-end job or worry about future threats to job security. It could also be a field issue, such as concern about making decisions that could bankrupt your employer or the perception that your long hours at work are making you lose touch with your family.

When you evaluate a possible change to your career, be sure to consider the change from the perspectives of all three aspects. For example, if you decide to get a degree or certification to improve your future employability (which you may think of as a wave-related change because it happens over time), consider the particle issues that this will raise, such as how well your skills and aptitudes will match the demands of the program. Consider also such wave issues as how the program’s demands on your time will affect your family relationships or how you can leverage your new credentials to achieve greater recognition in your industry.

Your career affects so many aspects of your life that you need to be multidimensional in your thinking when you assess your satisfaction or make plans for improving your situation. Tagmemics can provide a structure to help you expand your thinking.

Tuesday, May 31, 2016

Is the World of Work Really Hexagonal?

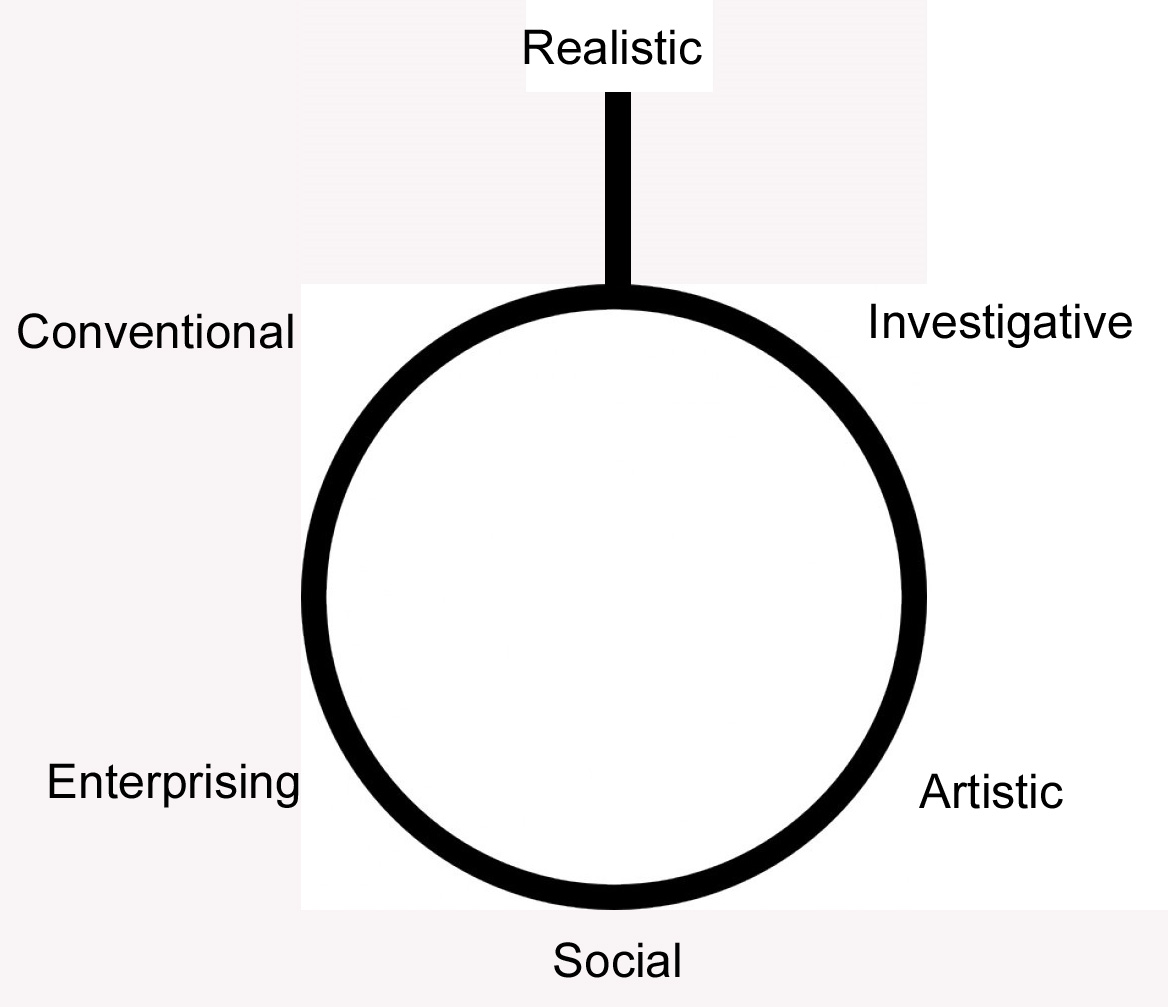
The Holland hexagon is perhaps the best-known schematic representation of people's work-related interests. This interest scheme is used with the understanding that interests on adjacent angles of the hexagon are more closely related--i.e., more likely for people to share--than interests on more widely separated angles. For example, people are thought to be more likely to have the profile RI than RS. A lot of research has been done to confirm or refute this layout, based on how people have responded to interest inventories that report out the RIASEC Holland codes. For example, I might examine people's scores to see whether their I scores indeed correlate more strongly with their R and A scores than they do with their E scores. Several researchers have done this; a good bibliography of these studies may be found in "The Structure of Vocational Interests," by Itamar Gati.

Keep in mind, however, that the Holland theory is based on the principle of congruence: that people should seek types of work that are good fits for their interests--in terms of tasks, settings, and the personalities of co-workers. Congruence makes sense as a goal only if the world of work can be described in the same terms as people's interests. With regard to the Holland scheme, this means that the opportunities for satisfaction of interests that exist in the world of work should also be describable by the same hexagon.

But are they? I'm not aware of any studies that have tested this hypothesis. To do so, one needs a data set that describes the world of work--that is, it describes a comprehensive set of occupations--in RIASEC terms. Then one can see whether the occupations really do distribute themselves around a hexagonal shape.

Most data sets of this kind provide one-, two-, and three-letter RIASEC codes for occupations. For example, one might consult the Dictionary of Holland Occupational Codes, co-authored by Holland himself. I decided instead to use data from the O*NET database, which rates 974 occupations on the RIASEC interests. This data set is not only more readily available at no cost, but it also provides numerical ratings that represent differences among occupations that are more nuanced than just permutations of six letters. In the O*NET database, two occupations that have the same Holland code might have somewhat different numerical ratings. For example, take Educational, Guidance, School, and Vocational Counselors and Recreation and Fitness Studies Teachers, Postsecondary, both of which are coded S. In the O*NET database, the former has an S rating of 7, while the latter's S rating is only 6.67. In each case, the S rating is so much higher than the ratings for the other five Holland types that the occupation is given only the single S code; nevertheless, the ratings indicate that one occupation is a bit more Social than the other.

I used the numerical ratings from the most recent release of the O*NET database (20.3). When I ran correlations between occupations' ratings on the six RIASEC interests, I found the figures illustrated on the hexagon below:

Among five of the interests--IASEC--the correlations support the prediction that interests will have a positive correlation with interests on adjacent angles and a negative or negligible positive correlation with interests at a distance of two angles--and, furthermore, that correlations between interests at opposite angles will be more strongly negative. But the sixth interest, Realistic, is anomalous; it shows only a negligible (and negative) correlation with the two interests (C and I) that are supposed to be adjacent. To be sure, it shows negative correlations with the opposite interest (S) and the two-angles-away interests (E and A). In any diagram, it should be placed distant from them; but it should also be placed farther from C and I than any other pairs of adjacent angles are distant from each other.

Because Realistic shows no positive correlation with any other interest, a hexagon does not adequately describe its relationship to the other interests. I suggest that if we must use a geometrical shape to describe the layout of the six interests, we need one that allows Realistic to sit away from the others. Perhaps this is best shown as a diagram resembling a frying pan:

On the other hand, there is a good argument for using a hierarchical arrangement of the six types, as Gati has proposed in the article cited above. A hierarchical model is based on the assumption that people make a first-cut decision between one group of interests and all other groups, and then make a second-cut decision between one interest and all others within that first-choice group. Gati created groups by observing that certain pairs of RIASEC codes had the highest correlations (in score data from assessments). Here is his hierarchical diagram:
My analysis of data from the world of work (specifically, O*NET data) suggests a somewhat different hierarchy: 


The first cut consists of choosing between R and everything else. The second cut recognizes two clusters (A and S, with a correlation of 0.31; and E and C, with a correlation of 0.27), and I standing off by itself because its best correlation (0.20, with A), is as weak as the E-S correlation.

The frying pan model has one advantage over the hierarchical model: It makes clear that diametrically opposed interests are more distant from each other than interests that are closer on the circumference.

Thursday, February 5, 2015

The Changing Expectations of Employers and Employees

As teenagers turn into adults, they and their parents need to renegotiate the terms of their relationship. The parents have to let go of the control that they had over their children’s’ lives, and the new adults have to learn how to fend for themselves without the parental safety net. The transition usually takes several years, during which there are always awkward, even painful moments when the two parties’ expectations don’t totally match.

Something similar has happened as the employer-employee relationship has changed in recent decades. Traditionally, employers have had certain expectations for their employees: high-quality work output, low absenteeism, a good attitude, and reasonable cost. Employees have had their own expectations: a reasonably good work environment, respect, steady employment, and at least a living wages. Starting in the late 1970s, these expectations began to weaken or even fall away, but during this period of transition, the two parties have often found their expectations were not in synch.

The first big dislocation was the wave of downsizing that began in the 1970s and 1980s. Companies decided that their need to contain costs was more important than meeting their employees’ expectation of steady work. Loyalty became a thing of the past. In making this move, employees banked on the notion that the quality of work output would not diminish with employees’ loss of security. My generation, the Baby Boomers, never completely adjusted to the new reality. Books like What Color is Your Parachute? taught many of us how to deal with this situation, but we did not and still largely do not accept that this is the way jobs ought to be. Our expectations are stuck in the model of the 1950s and 1960s economy.

However, it’s also true that many employers did not fully appreciate how they had changed the nature of the relationship. I experienced this when I returned as a consultant to work for a company where I had been downsized after many years as a salaried employee. The company presented me with a contract that included a two-year noncompetition clause. I was flabbergasted. The company was saying, in effect, that they had no loyalty to me but that I had to be 100 percent loyal to them. I refused to sign the contract unless that clause was removed. They needed my skills badly enough that they conceded on this point.

In the 1990s, automation killed off some jobs but added so much productivity to other jobs that the economy as a whole did very well, so the employer-employee relationship did not change greatly. But as the century turned, computers got smarter and began to displace more workers and, worse yet, globalization resulted in the offshoring of hundreds of thousands of manufacturing jobs. Employers were happy with the reduced cost of foreign workers and the quality of their work, while the absenteeism and attitude of these foreign workers were somebody else’s problem. To find steady work, many former employees of manufacturing jobs now had to shift to service jobs and lower their expectations for the work environment, for respect, and even for living wages.

The latest dislocation is the arrival of what is often called on-demand work or the “Uberization” of the workforce. Technology now makes it possible for employers to take on workers for assignments that last only a few hours or less. The work may be driving passengers for Uber or Lyft, performing cleaning or other home services for Handy (formerly Handybook), or doing almost any kind of low- to moderate-skill task for TaskRabbit or Mechanical Turk. By using these temporary workers, who are classified as independent contractors rather than employees, employers can still meet their expectations for low cost, and customer feedback about individual workers ensures that the quality of work output and perhaps workers’ displayed attitude will not suffer. Absenteeism is not a problem as long as there is a sufficient pool of interchangeable workers. Some workers are able to earn better than a living wage in these arrangements, but many do not, and few can count on steady employment or respect in this relationship.

It is possible that many workers have become so beaten down, especially following the Great Recession, that they have lowered their expectations to the point where they can accept this new relationship. But several lawsuits are revealing small but significant instances in which employers’ expectations are out of synch with the realities of using on-demand workers. Last year, FedEx drivers won an appeals court ruling that they are not independent contractors, because the employer requires them to wear company uniforms, drive company vehicles, and maintain company standards for grooming. A current lawsuit against Handy makes a similar argument, stating that the employer does not treat its workers as contractors because it requires them to adhere to strict guidelines on matters such as what clothes to wear, when to ring customers’ doorbells, when to listen to music, and how to use the bathroom. Still another lawsuit, this one also against Handy, happened when the company stopped using a contractor because she subcontracted the work to her sister.

In the traditional employer-employee relationship, the worker’s expectations of good work conditions and a living wage were guaranteed by laws that governed workplace safety, minimum wage, overtime pay, Social Security payments, unemployment insurance, and the right to unionization. These laws mostly do not apply to on-demand work situations. On-demand workers may also face new kinds of liabilities. For example, when I was a full-time employee and drove from my office to a meeting at another site, my employer provided insurance coverage for the trip. Uber drivers, on the other hand, are insured by Uber only for the time when they have a passenger in their car; they are not covered when they drive to, from, or between assignments.

Perhaps what is needed is a new category of worker, “dependent contractor,” who would have some protections that independent contractors lack. A court in Canada ruled that this kind of worker has the right to reasonable notice of termination. Germany recognizes several rights for these workers.

Can the United States protect on-demand workers? I am pessimistic. The major constituencies that influence workplace policy are the corporations and the unions. Most corporations are not interested in making these concessions to workers, and few on-demand workers are union members.

Tuesday, July 29, 2014

Home Can Be More Stressful Than Work

Workplace stress has been a longtime interest of mine, but now there is research indicating that for most people, being at home is more stressful than being at work. Does this seem counterintuitive to you?

One study asked volunteers to collect saliva samples over the course of the day. When the samples were analyzed for the presence of a stress hormone, it turned out that levels were significantly higher when the volunteers were at home, compared to levels at work.

Consider some of the reasons for workplace stress that occupations are rated on in the O*NET database:

  • Dealing with unpleasant or angry people
  •  Competition
  • Time pressure
  • Needing to be exact or accurate
  • Consequences of errors
  • Dealing with physically aggressive people
  • Conflict situations
  • Decisions that have impact on co-workers or company results
  • Working at a pace determined by the speed of equipment

Now consider some of the reasons for stress at home:
  • Dealing with unpleasant or angry family members or neighbors
  • Time pressure to meet nonwork commitments (such as housekeeping chores)
  • Conflict situations with spouse, children, or neighbors
  • Illness or death of a loved one
  • Unruly pets
  • Malfunctioning appliances or furnishings
  • Decisions that have impact on family
  • Adjusting to suit family members’ schedules
What’s the difference between these two sets of stressors? Researchers speculate that people are better able to shrug off workplace stressors because they imagine (whether realistically or not) that they always have the option of quitting their job (or getting a reassignment), whereas it is much less common to imagine walking away from domestic woes. In addition, people are more able to vent about workplace stressors, because it is socially more acceptable to complain about your boss or your clients than it is to badmouth your spouse or your kids.

It’s interesting that one group among those in the saliva study were an exception to the general trend and found work more stressful than time at home: people with high incomes. I’m not surprised. I have run correlations between stress factors and income, using the O*NET ratings and the BLS figures for median incomes across the spectrum of occupations. I find a correlation of 0.33 for Impact of Decisions and 0.34 for Level of Competition, as well as 0.25 for the overall need for Stress Tolerance. It seems that when you’re earning the big bucks, your home can really be a refuge from stress—although technology (a cell phone or a networked computer) is now allowing work to intrude on your time at home more than ever before.

I remember what my life was like when I was working as a lowly and low-paid research assistant at Educational Testing Service and had just bought my first house. On my weekends, I had so much fixing-up work to do on that little Cape Cod house that I was happy when Monday morning rolled around. I used to say to my carpool, “I’m so glad to get back to work. Now I can relax!”

Wednesday, May 14, 2014

Best Jobs Not Behind a Desk: Updated

This is an update to a book I wrote a few years back for JIST Publishing, featuring occupations that do not chain you to a desk. If you want to avoid the Dilbert style of work, you may want to consider one of the occupations on the list that follows.

If you're a bit antsy by nature, nonsedentary work may be a better fit for your energy level, and it probably will be better for your health. Researchers have linked desk jobs to increased incidence of back pain, eyestrain, obesity, and even colon cancer. One Australian study found that men who sit at their desks for more than six hours per day were almost twice as likely to be obese as men who sit for less than 45 minutes. An American study found that women who worked at a sedentary job for 14 years gained 20 pounds more than women who worked in the least sedentary jobs.

First, let me explain how I created this list. The O*NET database, created and maintained for the Bureau of Labor Statistics, rates about 1,000 occupations on the level of "general physical activity" that they require, using a scale that ranges from zero to 7. The O*NET also rates every occupation on how much sitting it requires, again using the zero-to-7 scale, so I subtracted this rating from 7 to obtain a rating for how much the occupation allows not sitting. Then I calculated the average of the two ratings--general physical activity and not sitting--and expressed this combined rating on a scale ranging from zero to 100. This is the "Activity Level" measure in the following list. Using this measure, I sorted all occupations for which I had a full set of data and eliminated those that make up the bottom half of the distribution--the 280 most sedentary occupations. The 280 remaining occupations offer at least a moderate amount of moving around.

Next, following the procedure I used in the Best Jobs series of books, I sorted these non-desk-bound occupations three times, using economic information I obtained from the BLS: annual earnings (based on May 2013 estimates), projected growth from 2010 to 2020, and projected annual openings over this same decade. Finally, I summed these three rankings to generate one overall ranking. Occupations with the best combination of economic rewards are to be found closest to the top of the list. Note that adjacent occupations often have only small differences in their overall scores, so a difference of a few places on the list usually is not very significant. Also understand that the earnings figures are national averages, and actual earnings vary by location, specialization, and other factors.

I think you'll agree that the following list covers a wide variety of occupations, with something for almost every interest except maybe the most bookish pursuits:

Rank
Occupation
Activity
Level
Annual
Earnings
Growth
2010-
20
Annual
Openings
1
Physical Therapists 65.7 $81,030
36.0%
12,370
2
Registered Nurses 54.3 $66,220
19.4%
105,260
3
Nurse Practitioners 52.9 $92,670
33.7%
5,850
4
Physician Assistants 55.7 $92,970
38.4%
4,890
5
First-Line Supervisors of Construction Trades and Extraction Workers 61.4 $60,380
23.5%
18,710
6
Occupational Therapists 55.7 $76,940
29.0%
4,820
7
Physical Therapist Assistants 61.4 $53,360
41.0%
4,510
8
Electricians 72.9 $50,510
19.7%
22,460
9
Plumbers, Pipefitters, and Steamfitters 74.3 $50,180
21.3%
13,050
10
Radiologic Technologists 64.3 $55,200
20.8%
6,960
11
Licensed Practical and Licensed Vocational Nurses 61.4 $41,920
24.8%
36,310
12
Surgeons 60.0 $187,200
23.2%
2,310
13
Occupational Therapy Assistants 61.4 $55,270
42.6%
2,050
14
Carpenters 77.1 $40,500
24.2%
32,920
15
Industrial Machinery Mechanics 72.9 $47,910
18.9%
15,250
16
Respiratory Therapists 60.0 $56,290
19.1%
4,010
17
Heating, Air Conditioning, and Refrigeration Mechanics and Installers 71.4 $43,880
20.9%
12,370
18
Cardiovascular Technologists and Technicians 61.4 $53,210
30.4%
2,300
19
Brickmasons and Blockmasons 82.9 $46,610
35.5%
3,280
20
Operating Engineers and Other Construction Equipment Operators 54.3 $42,540
18.9%
14,440
21
First-Line Supervisors of Mechanics, Installers, and Repairers 57.1 $61,220
7.8%
15,200
22
Surgical Technologists 62.9 $42,720
29.8%
3,910
23
Geoscientists, Except Hydrologists and Geographers 55.7 $91,920
15.8%
1,730
24
Veterinarians 62.9 $86,640
12.0%
3,100
25
Kindergarten Teachers, Except Special Education 54.3 $50,230
13.0%
6,510
26
Structural Iron and Steel Workers 80.0 $46,520
21.8%
3,150
27
Captains, Mates, and Pilots of Water Vessels 61.4 $69,920
13.8%
2,130
28
Police and Sheriff's Patrol Officers 58.6 $56,130
5.9%
24,390
29
Electrical Power-Line Installers and Repairers 74.3 $64,170
8.9%
4,990
30
Cement Masons and Concrete Finishers 75.7 $36,130
29.1%
5,720
31
Service Unit Operators, Oil, Gas, and Mining 77.1 $42,790
20.9%
3,640
32
Elevator Installers and Repairers 80.0 $78,640
24.6%
800
33
Radiation Therapists 62.9 $79,140
23.5%
840
34
Construction and Building Inspectors 61.4 $54,450
12.2%
3,670
35
Sheet Metal Workers 72.9 $43,890
15.5%
4,890
36
Insulation Workers, Mechanical 75.7 $40,500
46.7%
1,730
37
Chiropractors 67.1 $65,300
14.6%
1,520
38
Construction Laborers 77.1 $30,460
24.3%
48,910
39
Healthcare Practitioners and Technical Workers, All Other 60.0 $48,610
17.1%
2,280
40
Painters, Construction and Maintenance 61.4 $35,390
19.8%
11,050
41
Medical Assistants 54.3 $29,610
29.0%
26,990
42
Rotary Drill Operators, Oil and Gas 78.6 $51,570
18.6%
1,540
43
Computer Numerically Controlled Machine Tool Programmers, Metal and Plastic 54.3 $46,510
27.6%
1,350
44
Nuclear Medicine Technologists 54.3 $71,120
20.2%
720
45
Massage Therapists 65.7 $35,920
22.6%
4,410
46
Vocational Education Teachers, Postsecondary 54.3 $48,300
11.8%
3,660
47
First-Line Supervisors of Landscaping, Lawn Service, and Groundskeeping Workers 68.6 $42,570
12.7%
4,990
48
First-Line Supervisors of Fire Fighting and Prevention Workers 72.9 $70,040
6.3%
3,050
49
Emergency Medical Technicians and Paramedics 65.7 $31,270
23.1%
12,060
50
Millwrights 77.1 $50,030
18.4%
1,340

Thursday, March 10, 2011

Unhappy, Staying, but Not Stagnating

The consulting firm Accenture drew some attention recently with a survey of 3,400 business professionals in 29 countries that found that fewer than half of the respondents were satisfied with their current jobs. Men and women showed a similar level of discontent: only 42 and 43 percent reported job satisfaction.


The respondents showed a slightly greater gender divide when they identified the reasons for their frustration: being underpaid (cited by 47 percent of women versus 44 percent of men); a lack of opportunity for growth (36 percent versus 32 percent); no opportunity for career advancement (33 percent versus 34 percent); and feeling trapped (29 percent versus 32 percent).


For me, the most interesting finding was that nearly three-quarters (70 percent of women and 69 percent of men) plan to stay with their companies. The headline that many news services used for their coverage of the survey was something like “Unhappy Workers Do Little About It, Says Survey.”


But the research actually found the workers showing quite a bit of initiative. More than half of respondents (59 percent of women and 57 percent of men), say that, this year, in an effort to enhance their careers, they will work on developing their knowledge and/or a skill set to achieve their career objectives.


It’s no surprise that so many are planning to stay with their present employer. The economy is not offering a wealth of job openings in many, perhaps most of the countries surveyed. But another factor that is easily overlooked is the size of the companies that were surveyed: medium to large. Such employers may be expected to offer a modicum of opportunities for internal job movement, even in a slow economy. I expect that a survey of people at small companies would find more workers who are looking elsewhere for green grass.


Dissatisfied workers like the ones uncovered by this survey were some of the people I had in mind when I wrote 2011 Career Plan. My boss at JIST Publishing, Sue Pines, suggested that I model it on Suze Orman’s Action Plan, and I made a point of using a tone that is much more pushy (although I prefer the more positive and classier-sounding “hortative”) than I’ve ever used in my previous writing.


The idea is to goad readers into taking action. I want readers to commit to a specific career goal, whether it is achieving greater security in their present job (“Safeguarding”), seeking a promotion (“Climbing”), moving to another employer, but in the same occupation and industry (“Decamping”), moving to another employer and industry, but in the same occupation (“Revamping”), or switching to a new employer and a new occupation (“Reinventing”). For each goal, I suggest a strategy and specific action steps for pursuing that strategy.


For example, if acquiring better skills is part of the strategy (as it should be for the many Accenture-surveyed workers who want to climb the ladder at their present company), I identify ways to build skills, with tools that readers can use, such as the text of an e-mail that requests a skill-testing work assignment.


One of the premises of 2011 Career Plan is that this is a good year to take career-building action because job opportunities in the United States are finally starting to improve. When I wrote the book, in 2010, there was still a considerable amount of fear that a double-dip recession would reverse the few employment gains that had materialized by then. Since that time, however, my optimism is starting to look warranted. This month we are seeing much more encouraging news about job growth. The unemployment rate finally fell below 9 percent in February. The drop of almost one percent over the previous three-month period was the largest our economy has seen in nearly 28 years.


There are still some worries that rising oil prices will dampen economic growth (one more reason we need to shift to a green-energy economy!), but on balance 2011 looks like the time when dissatisfied workers--or anybody concerned about job security--should be making an action plan and taking steps to put it into effect.