Showing posts with label assessment. Show all posts

Tuesday, May 31, 2016

Is the World of Work Really Hexagonal?

The Holland hexagon is perhaps the best-known schematic representation of people's work-related interests. This interest scheme is used with the understanding that interests on adjacent angles of the hexagon are more closely related--i.e., more likely for people to share--than interests on more widely separated angles. For example, people are thought to be more likely to have the profile RI than RS. A lot of research has been done to confirm or refute this layout, based on how people have responded to interest inventories that report out the RIASEC Holland codes. For example, I might examine people's scores to see whether their I scores indeed correlate more strongly with their R and A scores than they do with their E scores. Several researchers have done this; a good bibliography of these studies may be found in "The Structure of Vocational Interests," by Itamar Gati.

Keep in mind, however, that the Holland theory is based on the principle of congruence: that people should seek types of work that are good fits for their interests--in terms of tasks, settings, and the personalities of co-workers. Congruence makes sense as a goal only if the world of work can be described in the same terms as people's interests. With regard to the Holland scheme, this means that the opportunities for satisfaction of interests that exist in the world of work should also be describable by the same hexagon.

But are they? I'm not aware of any studies that have tested this hypothesis. To do so, one needs a data set that describes the world of work--that is, it describes a comprehensive set of occupations--in RIASEC terms. Then one can see whether the occupations really do distribute themselves around a hexagonal shape.

Most data sets of this kind provide one-, two-, and three-letter RIASEC codes for occupations. For example, one might consult the Dictionary of Holland Occupational Codes, co-authored by Holland himself. I decided instead to use data from the O*NET database, which rates 974 occupations on the RIASEC interests. This data set is not only more readily available at no cost, but it also provides numerical ratings that represent differences among occupations that are more nuanced than just permutations of six letters. In the O*NET database, two occupations that have the same Holland code might have somewhat different numerical ratings. For example, take Educational, Guidance, School, and Vocational Counselors and Recreation and Fitness Studies Teachers, Postsecondary, both of which are coded S. In the O*NET database, the former has an S rating of 7, while the latter's S rating is only 6.67. In each case, the S rating is so much higher than the ratings for the other five Holland types that the occupation is given only the single S code; nevertheless, the ratings indicate that one occupation is a bit more Social than the other.

I used the numerical ratings from the most recent release of the O*NET database (20.3). When I ran correlations between occupations' ratings on the six RIASEC interests, I found the figures illustrated on the hexagon below:

Among five of the interests--IASEC--the correlations support the prediction that interests will have a positive correlation with interests on adjacent angles and a negative or negligible positive correlation with interests at a distance of two angles--and, furthermore, that correlations between interests at opposite angles will be more strongly negative. But the sixth interest, Realistic, is anomalous; it shows only a negligible (and negative) correlation with the two interests (C and I) that are supposed to be adjacent. To be sure, it shows negative correlations with the opposite interest (S) and the two-angles-away interests (E and A). In any diagram, it should be placed distant from them; but it should also be placed farther from C and I than any other pairs of adjacent angles are distant from each other.

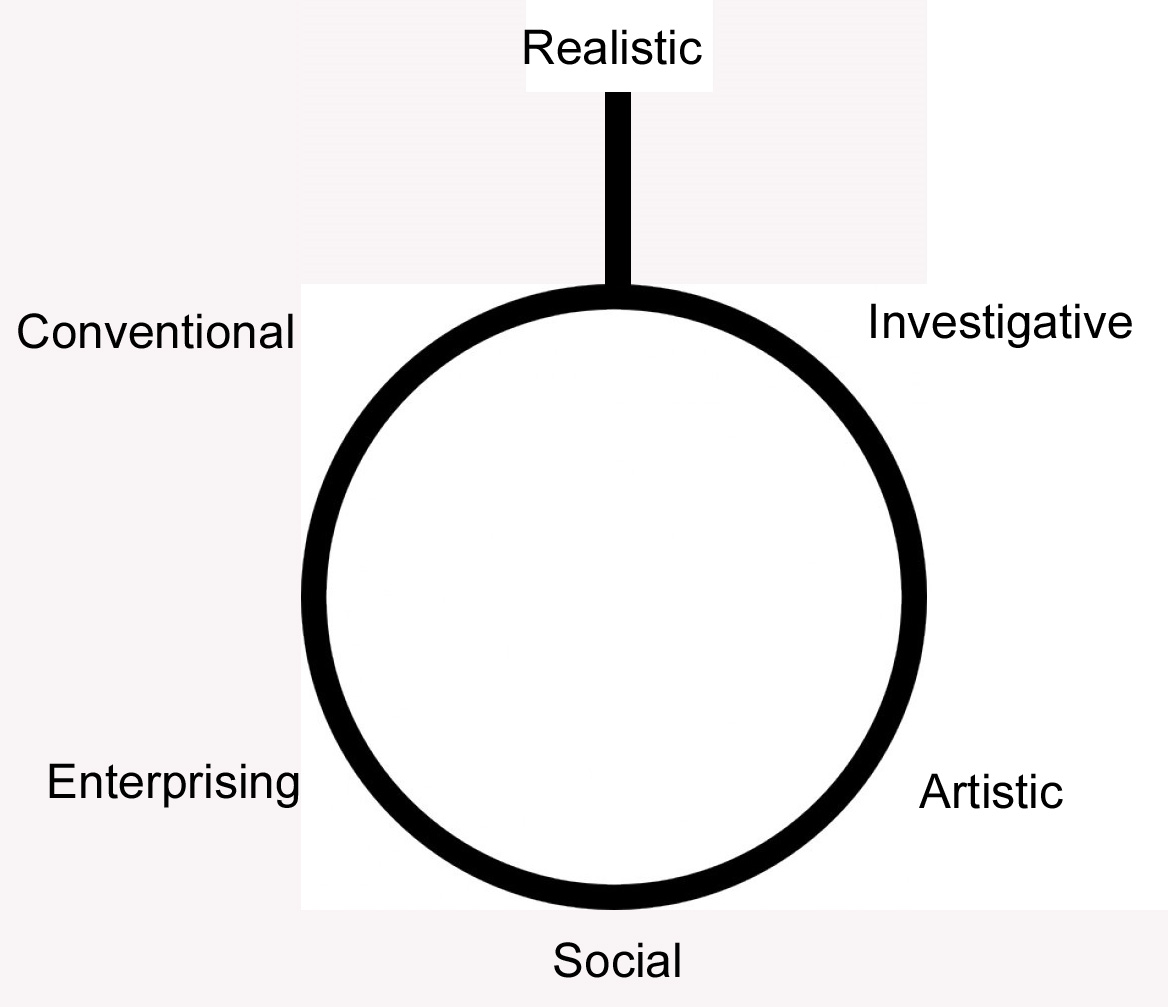
Because Realistic shows no positive correlation with any other interest, a hexagon does not adequately describe its relationship to the other interests. I suggest that if we must use a geometrical shape to describe the layout of the six interests, we need one that allows Realistic to sit away from the others. Perhaps this is best shown as a diagram resembling a frying pan:
On the other hand, there is a good argument for using a hierarchical arrangement of the six types, as Gati has proposed in the article cited above. A hierarchical model is based on the assumption that people make a first-cut decision between one group of interests and all other groups, and then make a second-cut decision between one interest and all others within that first-choice group. Gati created groups by observing that certain pairs of RIASEC codes had the highest correlations (in score data from assessments). Here is his hierarchical diagram:
My analysis of data from the world of work (specifically, O*NET data) suggests a somewhat different hierarchy: 


The first cut consists of choosing between R and everything else. The second cut recognizes two clusters (A and S, with a correlation of 0.31; and E and C, with a correlation of 0.27), and I standing off by itself because its best correlation (0.20, with A), is as weak as the E-S correlation.

The frying pan model has one advantage over the hierarchical model: It makes clear that diametrically opposed interests are more distant from each other than interests that are closer on the circumference.

Monday, July 21, 2014

Learning from Silly Assessments

Sometimes, you can learn about a serious matter by contemplating something silly. I have gained insights into serious career-related assessments by looking at frivolous assessments.

Almost every day, one or another of my Facebook friends is likely to post the results of a quiz that reveals such important insights as “What character in The Wizard of Oz are you?” or “Which state should you have been born in?” One quiz that appeared a few months ago even tried to reveal “What career should you be pursuing?” Call me a killjoy, but I am almost never tempted to take these silly assessments. I guess I worked at Educational Testing Service too long to be able to regard any assessment as harmless fun.

But I did make an exception for an assessment on Clickhole.com that lampoons these silly assessments: “Are You An Introvert, An Extrovert, Or A Sea Monster?” It offers items such as “What’s your signature look? (a) Bright and flashy. (b) Muted and professional. (c) A rippling shadow below the surface.”

In addition to poking fun at the proliferation of personality quizzes, this one points out a common failing of assessments: that the scale each item loads on is painfully obvious. In this example, it’s unmistakable that (a) loads on extroversion, (b) loads on introversion, and (c) loads on…well, you can guess.

The result of this transparency is that it’s easy for all but the most naïve test-takers to rig the answers. The first time I took a career assessment was in eighth grade; I was given one of the Kuder interest inventories. When it asked questions such as “Do you like adding columns of figures?” even a tweenie like me could tell that it was getting at my interest (or, in my case, lack of interest) in math. I knew I didn’t like math, so it was easy for me to make sure that the assessment results voiced this dislike loud and clear.

If you take the Clickhole.com assessment, you’ll notice something else that causes some assessments to be overly transparent: All of the items load the responses to (a), (b), and (c) according to the exact the same pattern as in the “signature look” example I cited above. Paper-and-pencil assessments almost universally follow this fixed method of arranging the options—in columns—to enable the test-taker to compute the scores simply by going down each column, counting the number of selections.

When an assessment is this transparent to the user, it wastes that person’s time. In eighth grade, I could have saved a lot of time and effort by simply rating 10 or so academic fields on a scale of one to ten—or by rank-ordering them.

To be sure, some very naïve clients may feel they benefit from this kind of assessment. These would have to be people with such sparse insights into their preferences that the assessment items are opaque to them; the scales the items load on are not obvious to them.

But there’s another major way in which career assessments fail. It’s the opposite situation: when the item-to-scale relationship is not at all obvious. That is, the test-taker fails to understand how his or her responses produced the end results. This kind of assessment is a black box, a fortune cookie. A sophisticated test-taker, rightly or wrongly, may be skeptical of the results from such an assessment.
To be sure, naïve test-takers (again) may feel they are benefiting from the assessment, in this case because of their blind faith in the accuracy of the results. But I do wonder how secure that faith is. I wonder especially how these test-takers will process any new self-insights that contradict the assessment results. Should they believe what the test told them or what they are now discovering about themselves?

That’s why I believe that the most useful way of assessing work-related preferences is by using informal methods based on introspection, such as making lists of enjoyable past experiences and drawing inferences from them. These methods definitely take more time and are vulnerable to the many distractions that our always-wired world throws at us. They also may be more difficult for clients who are naïve about their likes and dislikes, or those with limited inferential ability.

Finally, I realize that many people seeking career advice are simply lazy. “Just tell me what I should do,” they plead, and therefore they prefer a quickie assessment to the hard work of introspection and inference.
Nevertheless, because introspective and inferential methods require clients to do the work of prioritizing and inference themselves—and do not get their answers from a black box—the decision-makers buy into the results. And they can reinforce or refine their insights by factoring in additional information, such as their reactions to new experiences (say, job shadowing) or input from friends and family.

Wednesday, September 21, 2011

Use Common Sense with Assessments

I worked for 19 years at the nation’s premier testing company, and one thing I learned was not to be dogmatic about assessments. Even the makers of the mighty SAT exam freely admit that their scores do not predict college achievement as well as high school grades do. The SAT scores still have value, however, because when combined with high school grades, they give a better prediction than the grades could alone.

Something similar can be said about assessments that are designed to help you with career choice: Alone, they probably are not the best way to identify a promising career. But combined with other sources of information, they can be very helpful.

Incautious assessment users sometimes forget that psychological instruments are not as precise as a yardstick. Every assessment has a certain margin of error, meaning that although its scores put you into category x, there is a chance that you really belong in the neighboring category y. In baseball games, it’s usually pretty obvious whether a ball has landed in fair or foul territory. But imagine what accuracy would be possible if the ball were ten times as big as a beach ball and even more squishy: Even the instant replay would not resolve a borderline hit.

In baseball, it’s also helpful that the foul lines are at the edges of the area that the batter is aiming for. Now imagine what the game would be like if a line ran right down the middle of the field, and the score of the game depended on which side of the line the enormous beach ball fell on. For good measure, imagine that both right-handed and left-handed batters tended to hit the ball towards the middle. Now you have an idea why I’m reluctant to use the Myers-Briggs assessment. It attempts to place you on one side or the other of a bipolar range (e.g., introvert or extravert), although the normal distribution that is so typical of psychological characteristics clusters most people near the middle. There’s a very high likelihood that your actual location on this continuum is close enough to the middle that the inevitably imprecise measurement of the instrument will assign you to the wrong side of the middle.

Although I prefer to use assessments based on the Holland types, I have to caution that they also are unable to achieve a pinpoint focus. For the Holland types, let me change the metaphor from baseball to hopscotch, where a lot depends on which square your marker lands in. On the playgrounds where I grew up, the squares tended to be at least 10 inches across, but imagine how the game would be if they were only 3 inches across and your marker were a beanbag the size of a dinner plate. Fortunately, the Holland rationale is conceptually more forgiving of ambiguity than is the Myers-Briggs rationale, because it is not bipolar and accepts the notion that bordering types (for example, Realistic and Investigative) share some characteristics. If I can’t tell for certain whether my beanbag fell in the Realistic of Investigative square, I probably would not err greatly by favoring occupations coded RI, IR, or even just R or I.

But the really big mistake would be to rely solely on the assessment, whatever its rationale. Here are some other indicators of your interests and preferences that you should consider:
  • In what school subjects did I get the most enjoyment and the best grades?
  • What activities am I reluctant to drop at dinnertime?
  • What are my favorite sections of the newspaper or of news websites?
  • At a party, what kind of people would I be able to sustain a conversation with?
  • If you could meet the world’s greatest ____________ and get that person to share his or her secrets of success, what field would that person’s achievement be in? (Romance doesn’t count.)
Still another indicator is the opinion of a family member or of a friend who knows you very well. Explain the concepts that the assessment is designed to measure and ask this person which characteristics describe you best.

Making decisions is hard. People naturally tend to seek the quickest and easiest way to decide between x and y. This is one reason why people often perceive an assessment as the beginning and ending of the decision-making process. Instead, use an assessment as the start of a gradual process of self-discovery.