Showing posts with label O*NET. Show all posts

Friday, March 17, 2017

Where—and Which—Skill Demands Are Increasing Fastest

Someone recently asked me which occupations are seeing the greatest increases in skill demands. I decided to find the answer using the O*NET database.

Using the Skills tables from releases 11 (2006) and 21.2 (the most recent release), I compared the skill requirements for each occupation. Specifically, I used the Level scale and subtracted the rating for release 11 from the level for release 21.2. It’s interesting to note that the difference was not always a positive number; that is, for some skills for some occupations, the required skill level went down.

But I was interested in the total difference for each occupation, so I summed the differences and then ordered the occupations by this figure. Here, in descending order, are the top 20 occupations—that is, the occupations that had the greatest increases in their skill requirements:

Plasterers and Stucco Masons
Licensed Practical and Licensed Vocational Nurses
Criminal Investigators and Special Agents
Management Analysts
Aerospace Engineering and Operations Technicians
Engineering Teachers, Postsecondary
Agricultural Engineers
Sales Engineers
Anesthesiologists
Forestry and Conservation Science Teachers, Postsecondary
Fire Investigators
Forest and Conservation Workers
Respiratory Therapy Technicians
Structural Metal Fabricators and Fitters
Helpers--Pipelayers, Plumbers, Pipefitters, and Steamfitters
Segmental Pavers
Rotary Drill Operators, Oil and Gas
Geophysical Data Technicians
Materials Scientists
Oral and Maxillofacial Surgeons

The list is dominated by construction, engineering, and health-care occupations.

I was interested in which particular skills had the biggest increases for these occupations, so I sorted them, and here are the top 5 ramped-up skills for the top 5 occupations:

Plasterers and Stucco Masons: Equipment Maintenance; Equipment Selection; Technology Design; Repairing; Operations Analysis.

Licensed Practical and Licensed Vocational Nurses: Equipment Selection; Equipment Maintenance; Repairing; Installation; Troubleshooting.

Criminal Investigators and Special Agents: Equipment Selection; Equipment Maintenance; Repairing; Installation; Troubleshooting.

Management Analysts: Operation and Control; Installation; Equipment Maintenance; Quality Control Analysis; Troubleshooting.

Aerospace Engineering and Operations Technicians: Technology Design; Installation; Equipment Selection; Mathematics; Management of Material Resources.

It should be no surprise that the common thread among these increases in skill demands is technology. Technology is playing an increasing role in all of these industries.

Finally, I thought it would be interesting to see which skills showed increased demands across all occupations. Here are the top 10 O*NET skills, in descending order:

Equipment Selection
Installation
Technology Design
Equipment Maintenance
Troubleshooting
Learning Strategies
Repairing
Mathematics
Operations Analysis
Instructing

Again, it’s no surprise to find technology-related skills heavily represented here. And the presence of Learning Strategies indicates that workers need to be able to learn the new technologies that are being deployed in their worksites. It’s also interesting to find Instructing at the #10 spot. Evidently, as workers are spending more time in teams, it’s getting more important for them to be able to bring their teammates up to speed on the new technologies.

Tuesday, May 31, 2016

Is the World of Work Really Hexagonal?

The Holland hexagon is perhaps the best-known schematic representation of people's work-related interests. This interest scheme is used with the understanding that interests on adjacent angles of the hexagon are more closely related--i.e., more likely for people to share--than interests on more widely separated angles. For example, people are thought to be more likely to have the profile RI than RS. A lot of research has been done to confirm or refute this layout, based on how people have responded to interest inventories that report out the RIASEC Holland codes. For example, I might examine people's scores to see whether their I scores indeed correlate more strongly with their R and A scores than they do with their E scores. Several researchers have done this; a good bibliography of these studies may be found in "The Structure of Vocational Interests," by Itamar Gati.

Keep in mind, however, that the Holland theory is based on the principle of congruence: that people should seek types of work that are good fits for their interests--in terms of tasks, settings, and the personalities of co-workers. Congruence makes sense as a goal only if the world of work can be described in the same terms as people's interests. With regard to the Holland scheme, this means that the opportunities for satisfaction of interests that exist in the world of work should also be describable by the same hexagon.

But are they? I'm not aware of any studies that have tested this hypothesis. To do so, one needs a data set that describes the world of work--that is, it describes a comprehensive set of occupations--in RIASEC terms. Then one can see whether the occupations really do distribute themselves around a hexagonal shape.

Most data sets of this kind provide one-, two-, and three-letter RIASEC codes for occupations. For example, one might consult the Dictionary of Holland Occupational Codes, co-authored by Holland himself. I decided instead to use data from the O*NET database, which rates 974 occupations on the RIASEC interests. This data set is not only more readily available at no cost, but it also provides numerical ratings that represent differences among occupations that are more nuanced than just permutations of six letters. In the O*NET database, two occupations that have the same Holland code might have somewhat different numerical ratings. For example, take Educational, Guidance, School, and Vocational Counselors and Recreation and Fitness Studies Teachers, Postsecondary, both of which are coded S. In the O*NET database, the former has an S rating of 7, while the latter's S rating is only 6.67. In each case, the S rating is so much higher than the ratings for the other five Holland types that the occupation is given only the single S code; nevertheless, the ratings indicate that one occupation is a bit more Social than the other.

I used the numerical ratings from the most recent release of the O*NET database (20.3). When I ran correlations between occupations' ratings on the six RIASEC interests, I found the figures illustrated on the hexagon below:

Among five of the interests--IASEC--the correlations support the prediction that interests will have a positive correlation with interests on adjacent angles and a negative or negligible positive correlation with interests at a distance of two angles--and, furthermore, that correlations between interests at opposite angles will be more strongly negative. But the sixth interest, Realistic, is anomalous; it shows only a negligible (and negative) correlation with the two interests (C and I) that are supposed to be adjacent. To be sure, it shows negative correlations with the opposite interest (S) and the two-angles-away interests (E and A). In any diagram, it should be placed distant from them; but it should also be placed farther from C and I than any other pairs of adjacent angles are distant from each other.

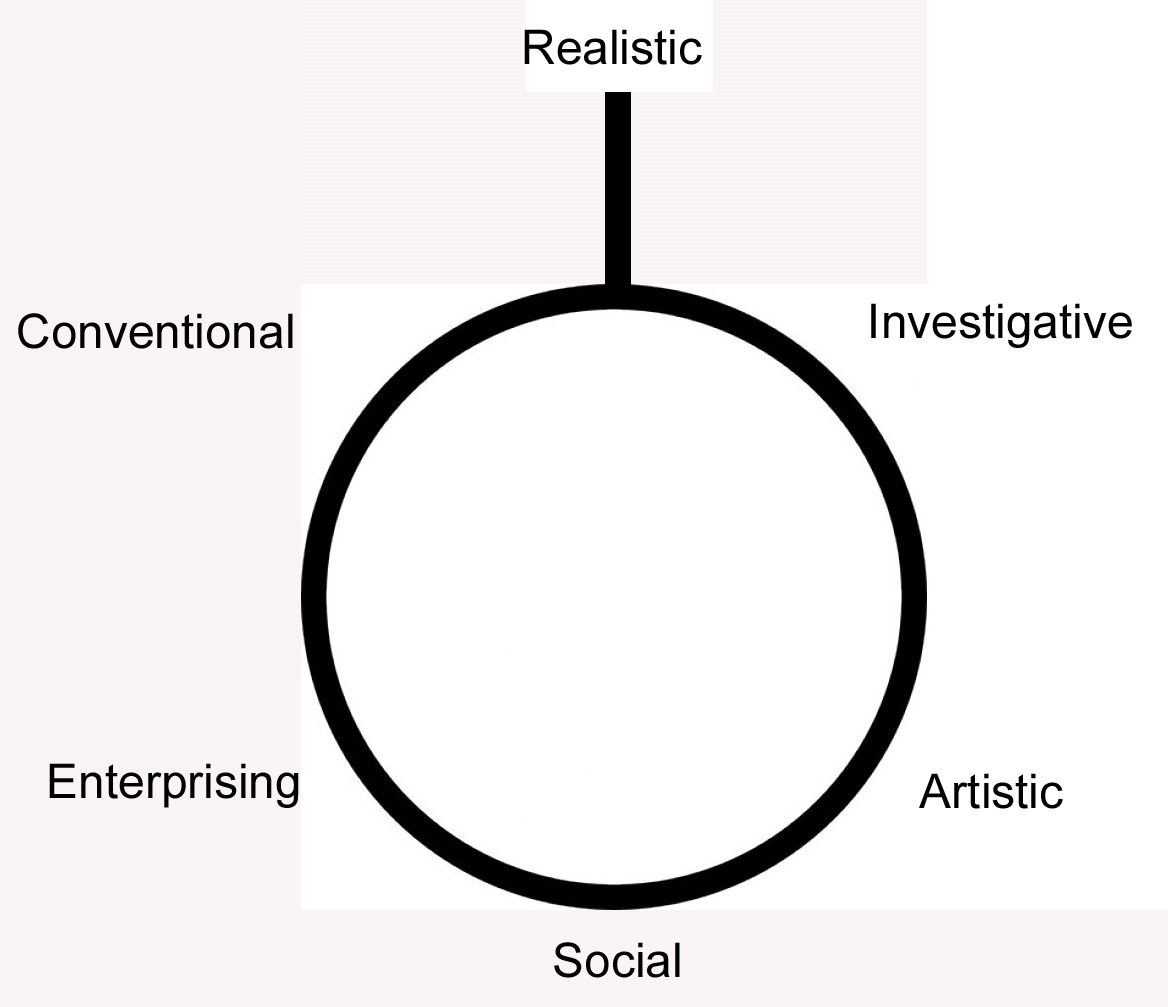
Because Realistic shows no positive correlation with any other interest, a hexagon does not adequately describe its relationship to the other interests. I suggest that if we must use a geometrical shape to describe the layout of the six interests, we need one that allows Realistic to sit away from the others. Perhaps this is best shown as a diagram resembling a frying pan:

On the other hand, there is a good argument for using a hierarchical arrangement of the six types, as Gati has proposed in the article cited above. A hierarchical model is based on the assumption that people make a first-cut decision between one group of interests and all other groups, and then make a second-cut decision between one interest and all others within that first-choice group. Gati created groups by observing that certain pairs of RIASEC codes had the highest correlations (in score data from assessments). Here is his hierarchical diagram:
My analysis of data from the world of work (specifically, O*NET data) suggests a somewhat different hierarchy: 


The first cut consists of choosing between R and everything else. The second cut recognizes two clusters (A and S, with a correlation of 0.31; and E and C, with a correlation of 0.27), and I standing off by itself because its best correlation (0.20, with A), is as weak as the E-S correlation.

The frying pan model has one advantage over the hierarchical model: It makes clear that diametrically opposed interests are more distant from each other than interests that are closer on the circumference.

Wednesday, May 1, 2013

Recent Trends in Work Conditions

Money isn't everything. When choosing a career, most people also consider the work conditions. Will the job be mainly indoors or outdoors? Will it involve a lot of time pressure or high-impact decisions that add stress? It's nice to be able to choose work conditions that agree with you, but sometimes the jobs that are available do not offer exactly what you want, so you have to make compromises if you want to earn a paycheck.

As the economy changes over time, there are changes in the salience of various work conditions that people deal with on the job. I decided to identify recent trends in work conditions by examining recent data about occupations and about the changing levels of employment in occupations. Which work conditions are becoming more prevalent and which are receding?

Here is the procedure that I used to track several work conditions:

  • I used workforce estimates for the years 2006 through 2012 from the Occupational Employment Statistics survey of the BLS. Note that this covers most but not all workers; self-employed workers are not included.
  • For each occupation, I multiplied the workforce size at each year by the numerical ratings for various work conditions in the O*NET database (where they are called Work Context elements).
  • For each year and for each work condition, I summed the products for all occupations and summed the workforce sizes of all occupations.
  • For each year and for each work condition, I divided the sum of products by the sum of workforces to get an overall quotient that indicated the level at which that work condition was significant for the nation’s workforce during that year.
  • Finally, I graphed the changing levels for each work condition.
Note that each chart below uses a different vertical scale, and that this scale is selected to emphasize the vertical movement of the curve. If I had plotted all the curves on a single chart, the vertical movement of some of the curves would not have been as evident. I'm more interested in the direction of movement than in the absolute value of the movement.

The first two charts show the trends for outdoors and indoors work. (Actually, in O*NET, the specific work conditions I used were "Outdoors, Exposed to Weather" and "Indoors, Environmentally Controlled.") As you might expect, the two curves are almost mirror images, and the general trend is away from outdoors work (although there has been a leveling-off in the most recent years). One factor contributing to that trend is the increasing mechanization of agriculture. Another factor is the decline in construction work that followed the collapse of the housing bubble.


You may wonder why the two preceding curves are not exact mirror images--why indoors work falls off very slightly during the recovery even though outdoors work does not pick up by a comparable amount. I found that the slight dip in indoors was offset by slight increases in work done in interior environments without climate controls (such as the jobs done by some warehouse workers and mechanics) and in enclosed vehicles (such as the jobs done by transportation workers and many sales workers). These mini-trends reflect the job growth that happened following the Great Recession, in which office jobs did not return as fast as some skilled blue-collar jobs.

You can see more evidence of this mini-trend in the following chart, which shows the trends in sedentary jobs.This chart shows a curve almost identical to the curve for indoors work.


The trend in what O*NET calls "Degree of Automation" may surprise you by its downward slope. Isn't automation constantly increasing? Understand that the curve represents not the amount of automation being used but rather the number of workers whose jobs involve a lot of automation. Most employees in manufacturing have worked with automation for a long time, so when automation reaches the point that it eliminates a manufacturing job, that's one less automation-related job. An additional drain on automation-related jobs was occurring in the years 2006 through 2009, when many highly automated jobs were being shifted to plants in foreign countries.

On the other hand, you'll note that the slope has pretty much leveled off in the most recent years. I interpret this to mean that automation is not a threat as much as it is the new normal. It's getting harder and harder to find new ways to automate jobs, and the great bulk of automation-using jobs that can be shipped overseas already have been offshored. Nowadays we're actually seeing an increase in advanced manufacturing jobs.


If automation is the new normal, what does this mean for you as a worker? It means that you need a high level of skills, either for doing the things that automation can't do (making sophisticated judgments or using people skills) or for doing the technological work of creating and programming automated equipment. And this is true no matter whether your work is indoors or outdoors, standing or sitting.


Wednesday, December 19, 2012

Researching an Occupation Before an Interview

In September, I blogged about the importance of researching the employer before you walk into an interview. This week’s blog is about researching the occupation for which you’ll be interviewed.

If you work with job-seekers who are still in school or recent graduates, you may have to impress on them the importance of researching the occupation that is their career goal. Here are some reasons to mention:

Question the interviewer might ask: “The most important work tasks are x, y, and z. Do you think you can do these tasks? Do you have a problem with any of these tasks?”
What you need to research about the employer: The most important work tasks
Advantage you gain: You can be ready with examples of your work or schooling that show you can do the work tasks. You’ll know whether the work tasks at this particular job are easier or harder than what’s typical.

Question the interviewer might ask: “On this job, the tools we use are x and y. Tell me about your experience using these.”
What you need to research about the employer: Typical tools and technologies
Advantage you gain: You can be ready with examples that show you are skilled with using these tools and technologies.

Question the interviewer might ask: “I’ve just described the work conditions here. Do you think you would be comfortable with them?”
What you need to research about the employer: Typical work conditions (indoor/outdoor, pressure, hours, travel, etc.)
Advantage you gain: You can decide whether the conditions at this particular job are better or worse than average.

Question the interviewer might ask: “Why do you want to work here? How do you see your future in this job?”
What you need to research about the employer: Future job trends
Advantage you gain: You understand what the future job opportunities will be with this type of employer. You can explain how you’ll serve future needs.

(What about how whether the employer pays a salary that’s appropriate for the occupation? You’ll need to know that eventually, when the interviewer offers you the job, but not for the initial interview.)

As you conduct research, for each question you investigate about the occupation, you’ll need to ask a corresponding question of yourself: specifically, “Am I ready for and comfortable with this aspect of the occupation?” Your answers to this question will help you be ready to decide whether or not the way the occupation is done at this employer suits you.

An exercise for conducting the research:
Start by looking at the work tasks. O*NET Online is an excellent resource for these inquiries. Search for the occupation and print out the Summary Report.

Make a Work Tasks Table. Divide a sheet of paper into three columns. In the first column, write each bulleted item on the Task list. In the middle column, make a mark to indicate whether you are ready for that task and comfortable with it. Use the right column for comments about the middle column:
  • If you’re not comfortable with a task, explain how you think you might work around it.
  • If you’re ready for a task, note how you learned it (training, work experience).
  • If you’re not ready for a task, explain how you intend to learn it (on-the-job training, a future class, or maybe you consider it unimportant for the job opening you have in mind).
How to use the Work Tasks Table before a job interview:
Find out as much as you can about the work tasks for the particular job opening you will be interviewed for:
  • If the job has been advertised, the advertisement probably mentions some tasks.
  • If the job has not been advertised, you may be able to find out something about the tasks by word of mouth.
  • In either case, you may be able to obtain a job description published by the employer. It will identify some tasks.
Compare the tasks of the particular job opening to the tasks listed in the table. On a paper pad, jot down some notes for the interview:
  • Look at the tasks that you’re ready for and comfortable with.
    • If the particular job involves some of these tasks, be prepared to mention how you mastered these tasks (class, work experience).
    • If the particular job does not involve some of these tasks, be prepared to ask why not.
    • Look at the tasks that you’re not ready for.
      • If the particular job involves some of these tasks, be prepared to ask whether you can get help learning how to do them.
      • If the particular job does not involve some of these tasks, you may want to ask for confirmation that it doesn’t, although you should express your willingness to learn them eventually.
      • Look at the tasks that you’re not comfortable with.
        • If the particular job does not seem to involve some of these tasks, you may want to ask for confirmation that it doesn’t.
        • If you learn at the interview that the job does involve some of these tasks, be prepared to explain how you’ll deal with them.

Wednesday, July 7, 2010

New Release of Career Information

This week’s blog entry is aimed mostly at career-information geeks who, like me, are thrilled by each new release of the O*NET database. Release 15 came out while I was away from home, at the National Career Development Association conference, so I didn’t get a chance to play around with it until today.

No new occupations were added this year. However, I am very pleased to note that data regarding skills, work styles, and other domains now may be found for 45 occupations that previously had only definitions and lists of work tasks. A list of these occupations appears below. Of these, all except the last two were added to the O*NET database only last year.

I am not surprised that many of these expanded-data occupations are in health care; this is America’s largest and fastest-growing industry. You may have already had a personal encounter with a worker in one of these occupations, such as Nuclear Medicine Physicians, Nurse Practitioners, or Endoscopy Technicians.

But I am especially happy that many of the expanded-data occupations are STEM (science, technology, engineering, math) occupations. Our economy needs an infusion of workers into STEM careers, so it’s important for these occupations to have a higher profile than in the past, giving career decision makers more opportunities to consider them.

Only a few titles on the list below (notably Energy Auditors and Energy Engineers) are clearly identifiable as green occupations. Nevertheless, I can’t say I’m disappointed that this release does not expand the data for many more green occupations. The field is so recently emerged that I simply would not be realistic if I expected the full range of data for these occupations already.

11-9111.01 Clinical Nurse Specialists
11-9199.01 Regulatory Affairs Managers
11-9199.04 Supply Chain Managers
13-1041.07 Regulatory Affairs Specialists
13-1199.01 Energy Auditors
13-2099.04 Fraud Examiners, Investigators and Analysts
15-1051.01 Informatics Nurse Specialists
15-1099.06 Geospatial Information Scientists and Technologists
15-2041.01 Biostatisticians
15-2041.02 Clinical Data Managers
17-1022.01 Geodetic Surveyors
17-2199.02 Validation Engineers
17-2199.03 Energy Engineers
17-2199.04 Manufacturing Engineers
17-2199.07 Photonics Engineers
17-2199.08 Robotics Engineers
17-3029.04 Electronics Engineering Technologists
17-3029.06 Manufacturing Engineering Technologists
17-3029.09 Manufacturing Production Technicians
19-1029.02 Molecular and Cellular Biologists
19-1029.03 Geneticists
19-2099.01 Remote Sensing Scientists and Technologists
19-3039.01 Neuropsychologists and Clinical Neuropsychologists
19-4099.02 Precision Agriculture Technicians
29-1069.03 Hospitalists
29-1069.05 Nuclear Medicine Physicians
29-1069.09 Preventive Medicine Physicians
29-1111.01 Acute Care Nurses
29-1111.02 Advanced Practice Psychiatric Nurses
29-1111.03 Critical Care Nurses
29-1122.01 Low Vision Therapists, Orientation and Mobility Specialists, and Vision Rehabilitation Therapists
29-1199.02 Nurse Anesthetists
29-1199.03 Nurse Practitioners
29-1199.04 Naturopathic Physicians
29-1199.05 Orthoptists
29-2011.01 Cytogenetic Technologists
29-2011.02 Cytotechnologists
29-2011.03 Histotechnologists and Histologic Technicians
29-2099.01 Electroneurodiagnostic Technologists
29-2099.03 Ophthalmic Medical Technologists and Technicians
29-2099.04 Nurse Midwives
29-9099.02 Genetic Counselors
31-9093.01 Endoscopy Technicians
33-9099.01 Transportation Security Officers
15-1099.03 Network Designers