Showing posts with label BLS. Show all posts

Thursday, January 14, 2016

This Year’s Biggest Changes in Outlook

Early last month, the Employment Projections office at the Department of Labor released its projections for the decade from 2014 to 2024. Later in the same month, the BLS released the text of the Occupational Outlook Handbook (OOH), which was based in part on those projections. Both of these resources are updated every two years, and I thought you’d be as interested as I am in seeing which occupations have the forecasts that are the most greatly revised from the previous update.

The economic models that BLS uses are not foolproof. Sometimes new data comes in that makes the economists at BLS realize they have significantly overestimated or underestimated the growth an occupation can expect. The outlook may change for many reasons, such as new developments in technology, international trade, consumer tastes, or the formulas Medicare uses in reimbursing health-care providers. For an understanding of what may have changed, I find it useful to look at the “Job Outlook” section text of the OOH statement (article) about an occupation, comparing the wording in the previous edition to the wording that appears there now. (You can make the same comparisons by looking at the previous OOH edition stored in the Wayback Machine site.) But often it’s hard to find a good explanation of what accounts for the revised forecast.

A useful example is Wind Turbine Technicians. This is the occupation with the greatest increase in its projected growth: from a formidable 24 percent growth projected for 2012–2022 to an amazing 108 percent projected for 2014–2024. However, the OOH outlook wording has changed very little between the previous edition’s statement and the current edition’s. The major difference is that only the previous edition has this wording: “In addition, the Renewable Electricity Standard calls for 25 percent of U.S. electric power generation to come from renewable sources by 2025, which should further drive employment growth.” Although the new edition doesn’t mention the Renewable Electricity Standard, presumably this commitment is continuing to drive growth, but it’s interesting to note that the number of states with this standard in place has not increased over the past three years—both then and now, it came to 29 states, the District of Columbia, and two U.S. territories. A change that may be more relevant to the revised forecast appears in the wording regarding offshore wind turbines. The current edition lacks a cautionary sentence that appears in the previous edition: “However, the high cost of building wind towers in the ocean may inhibit new offshore projects from being approved.” Still, I wonder whether the cost of building offshore turbines has fallen enough to make this sentence no longer necessary.

I don’t want to make too much of this apparent disconnect between the greatly changed numbers and the mostly unchanged prose. The outlook section notes that this is a very small occupation (in fact, employing only 4,400 workers in 2014), so the sextupling of projected new job openings, from 800 to 4,800, still does not represent a large number of new opportunities.

Something similar seems to have happened with another small occupation, Forensic Science Technicians. In the past two years, its ten-year job-growth projection has soared upward from 6 percent to 27 percent. However, the OOH outlook section has changed little from the previous edition. In fact, the main difference is that only the latest edition offers this advisory sentence: “Larger police departments will be more able to staff full-time forensic science technicians, but they, too, may face budget constraints.” Again, both editions note that this is a very small occupation (with 14,400 workers in 2014), so relatively small changes in the economy can cause a large change in outlook without actually creating a comparably large number of new jobs.

Not all the occupations with greatly changed forecasts were those with small workforces. For example, Personal Care Aides (1.8 million workers) had its growth projection cut almost by half: from 49 percent to 26 percent. Yet, again, the text of the OOH outlook section shows almost no revision, except for the removal of the word “companionship” (as one of the functions of the occupation) in two places and the removal of this paragraph: “Clients often prefer to be cared for in their own homes, rather than a home care facility or hospital. Studies have found that home treatment is frequently more effective than care in a nursing home or hospital.”

Another large occupation with a big change in forecast is Market Research Analysts, which was projected to grow by 32 percent for 2012–2022 but only by 19 percent for 2014–2024. In the wording of the OOH outlook section, there is one hint of a reason for this change. The following sentence was cut from the current OOH: “Rapid employment growth in most industries means good job opportunities should be available.” This deletion reflects the overall downward forecast for job growth: The projection for all occupations changed from 10.8 percent to 6.5 percent. I compared the old projections with the new ones and found a mean (unweighted) change of -5.5 percentage points.

Nevertheless, for occupations that had greatly changed forecasts, I would appreciate a better indication in the OOH outlook section of what factors have changed expectations.

Here is a list of the 20 OOH occupations that had the greatest revisions (either upward or downward) in their projections for job growth.

Occupation
Projection for 
Job Growth
(Percent)
2012–
2022
2014–
2024
Wind Turbine Technicians
24.5
108
Diagnostic Medical Sonographers 
and Cardiovascular Technologists 
and Technicians, Including Vascular 
Technologists
38.8
0.2
Market Research Analysts
31.6
0.2
Nurse Anesthetists, Nurse Midwives, 
and Nurse Practitioners
31.4
0.3
Geographers
29
-1.6
Mental Health Counselors and 
Marriage and Family Therapists
29.1
0.2
Skincare Specialists
39.8
12.1
Insulation Workers
37.6
13.3
Medical Equipment Repairers
30.3
6.1
Political Scientists
21.3
-2.3
Meeting, Convention, and Event Planners
33.2
9.9
Personal Care Aides
48.8
25.9
Software Developers
21.9
0.2
Health Educators and Community 
Health Workers
21.5
0.1
Surveying and Mapping Technicians
13.5
-7.6
Radiologic and MRI Technologists
21.2
0.1
Pest Control Workers
19.7
-1.2
Forensic Science Technicians
5.8
26.6
Nursing Assistants and Orderlies
20.9
0.2
Bill and Account Collectors
14.7
-5.6

Wednesday, November 19, 2014

Conspiracy Theories About Jobs Numbers

Every month, the Labor Department releases figures on the current state of the economy, and every month, without fail, malcontents take to the media to say that the numbers are phony. For example, Paul Singer, a hedge fund billionaire and prominent donor to Republican candidates, recently wrote to his investors, “Nobody can predict how long governments can get away with fake growth, fake money, fake jobs, fake financial stability, fake inflation numbers and fake income growth.”

If you have read my books, you know that I rely heavily on data from the U.S. Department of Labor, so it’s obvious that I don’t share Singer’s skepticism. The data analysts at DOL are career civil servants without a stake in enhancing the reputation of whoever happens to be in power. More important, if there were a vast conspiracy to conceal the true state of the economy, surely someone would play the Edward Snowden role and blow the whistle.

It’s true that the unemployment figure does not indicate the actual percentage of people out of work, because it covers only those who are looking for work and ignores those who have given up. But how many times does the public need to be told this? The Labor Department never pretended otherwise. The numbers are what they are.

Last week, a friend of mine whom I have known since seventh grade pointed out an example of the absurdity of the conspiracy theorists. He wrote on Facebook,

You may have heard about the jobs report that came out last week. The mainstream media generally received it as good but not super—248,000 jobs added (200,000 is order-of-magnitude break-even). Now, this is seasonally adjusted, and October is a strong month for jobs, so it was adjusted down, by a lot, in fact—800,000 or so. If the adjustment formula from last year had been used, growth would have been around 100,000 more. So sure enough, the daily stock market letter I look at has rumblings about government fraud to report the low number. The logic is that acknowledging the true extent of expanding employment would have undercut the case for low interest rates.

He goes on to note another competing conspiracy theory, regarding the other number that was reported—the unemployment percentage:

On the other hand, following links from the newsletter, I find another deep thinker saying that the reported unemployment rate is too low because of fraudulent underestimation of the potential work force. The reason for that fraud would be to minimize the appearance of troubles. So is the current employment picture better or worse than the government is telling us?

As my friend observes in conclusion, these market-watchers accuse the government of “two separate conspiracies working at cross-purposes.” Surely the government can’t be lying to make the economy look both better and worse than it really is.

Writing in The New York Times, Floyd Norris acknowledges that sometimes the reported economic indicators are inaccurate, but this is not because of a conspiracy to make the administration in power look better. Rather, it’s because when Labor’s economic analysts adjust figures, they tend to extrapolate from current trends. If the economy reverses direction, this tendency can cause economists to get the numbers wrong. When the economy goes into free-fall, they may overstate performance, but when it bottoms out and starts to improve, they may understate the situation. He gives the example of a 2012 Twitter comment by Jack Welch, the former chief executive of General Electric, who said that the reported decline in unemployment at that time was “unbelievable.” (This was in October of a presidential election year.) In fact, the figures later had to be readjusted to reflect the fact that the emerging economic recovery was actually more rapid than the initial figures indicated. (Incidentally, following Welch’s comment on Twitter, several other messages pointed out Welch’s reputation for manipulating the numbers reported for GE Capital.)

Norris recommends skepticism in situations where there are “rapid changes in any indicator, particularly if other indicators do not show similar changes.” But he cautions that we should “separate reality from ideology.”

Wednesday, May 7, 2014

Recovery from Recession: Comparing States

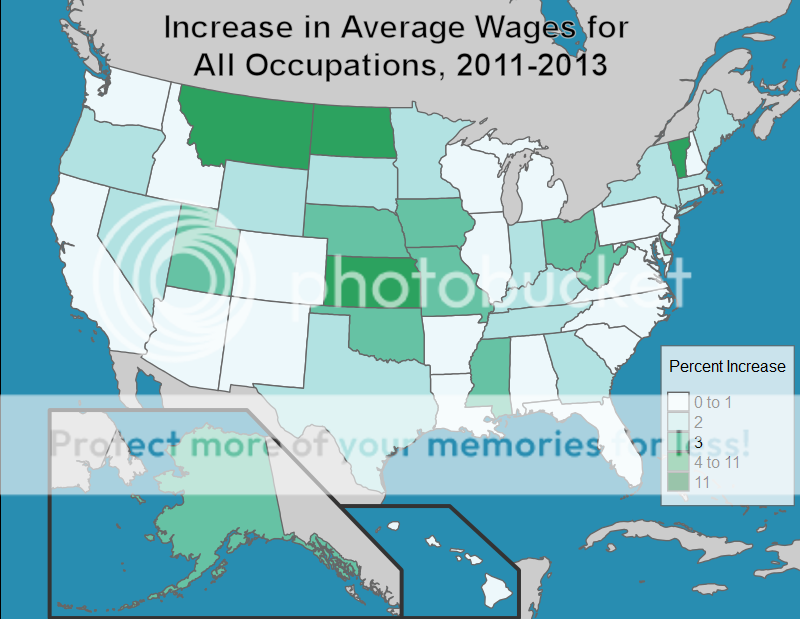
The nation's recovery from the Great Recession is proving to be uneven, with some states still stuck in the downturn and others bouncing back. I used figures from the Bureau of Labor Statistics released only two weeks ago to see how states compared. The maps below show what I found.

I created two maps, one that looks at the increase in average wage across occupations and the other that looks at the increase in total workforce size:


The outstanding state obviously is North Dakota, where the petroleum boom is lifting both wages and employment by high percentage figures (11.2 percent and 13.8 percent).

Some states show very difference performances on the two maps. For example, Colorado's workforce increased by a healthy 5.3 percent, but its average wage increased by only 1.2 percent. In other words, most of the jobs it gained were low-wage jobs. (Three Sunbelt states--California, Arizona, and Florida--experienced similar lopsided gains.) By contrast, West Virginia's workforce expanded by only 1.3 percent, but its wages gained by a substantial 3.8 percent. Perhaps the small size and low population density of this state contributed to this phenomenon (and similar results in Vermont); to expand the workforce even by a small amount, employers had to jack up wages more than was necessary in more crowded states.

My state, New Jersey, bears the shame of posting less than 2 percent gains on both measures. We Garden Staters share this dubious distinction with New Mexico, Arkansas, Mississippi, Pennsylvania, and Rhode Island.

Thursday, May 1, 2014

New Wage Figures Reveal Trends of the Past Two Years


The BLS has just released the May 2013 estimates for wages in 800+ occupations. I thought it would be interesting to see which occupations showed the greatest and smallest increases in pay compared to previous years.

I decided that the best way to smooth out errors and focus on large trends would be to look at groups of occupations rather than detailed occupations and to look at the difference over two years rather than one year.

Here’s what I found:


Occupational Group
May 2011
May  2013
Change
Healthcare Support Occupations
$25,140
$26,080
3.7%
Computer and Mathematical Occupations
$75,080
$77,860
3.7%
Architecture and Engineering Occupations
$72,070
$74,530
3.4%
Business and Financial Operations Occupations
$61,700
$63,800
3.4%
Management Occupations
$92,880
$95,600
2.9%
Healthcare Practitioners and Technical Occupations
$59,570
$61,120
2.6%
Life, Physical, and Social Science Occupations
$59,330
$60,860
2.6%
Office and Administrative Support Occupations
$31,250
$32,010
2.4%
Community and Social Service Occupations
$39,880
$40,810
2.3%
Arts, Design, Entertainment, Sports, and Media Occupations
$43,640
$44,610
2.2%
Construction and Extraction Occupations
$39,820
$40,670
2.1%
Installation, Maintenance, and Repair Occupations
$40,600
$41,440
2.1%
Production Occupations
$30,670
$31,250
1.9%
All Occupations
$34,460
$35,080
1.8%
Building and Grounds Cleaning and Maintenance Occupations
$22,620
$22,970
1.5%
Personal Care and Service Occupations
$20,730
$21,010
1.4%
Sales and Related Occupations
$24,840
$25,160
1.3%
Transportation and Material Moving Occupations
$28,760
$29,100
1.2%
Legal Occupations
$75,470
$76,100
0.8%
Food Preparation and Serving Related Occupations
$18,900
$19,020
0.6%
Education, Training, and Library Occupations
$46,060
$46,140
0.2%
Protective Service Occupations
$36,740
$36,770
0.1%
Farming, Fishing, and Forestry Occupations
$19,460
$19,380
-0.4%
Teachers, Postsecondary
$64,592
$62,920
-2.6%


Perhaps the most powerful takeaway from this table is that wages are growing fastest among the STEM occupations—science, technology, engineering, and math.

Some occupations that will account for numerous job openings—notably the Building and Grounds Cleaning and Maintenance Occupations; the Personal Care and Service Occupations; and the Food Preparation and Serving Related Occupations—have experience slower-than-average wage growth. Yesterday’s Senate defeat of the bill to raise the minimum wage—a disgraceful defiance of overwhelming popular support—only reinforces this trend.

It’s interesting to note that three groups of blue-collar occupations have experienced slightly faster-than-average wage growth: Construction and Extraction Occupations; Installation, Maintenance, and Repair Occupations; and Production Occupations. These occupations require higher levels of skill than the wage-stagnant occupations in the previous paragraph. Production Occupations, in particular, have seen increased skill requirements as the low-skill workers in this field have been replaced by either robots or offshore workers.

Yes, but what about Postsecondary Teachers? Surely they require high levels of skill, not to mention high-level educational credentials, yet their wages actually lost ground over this two-year period. This downturn in annual wages reflects the fact that colleges and universities are increasingly using adjunct teachers. These temporary or part-time workers are paid on a different scale from tenured or permanent faculty.