I created the four graphs below by this method:
- As in the previous blog, I looked at changes over two pairs of years: 2007 and 2009 for the recession, and 2010 and 2012 for the recovery.
- I used workforce estimates from the Occupational Employment Statistics survey of the BLS.
- For each occupation, I multiplied the workforce size at each year by the numerical ratings for the 41 generic work tasks in the O*NET database.
- For each year and for each task, I summed the products for all occupations and summed the workforce sizes of all occupations.
- For each year and for each task, I divided the sum of products by the sum of workforces to get an overall quotient that indicated the level at which that task was important to the nation’s workforce during that year.
- For the recession and for the recovery, I computed the percentage change in the overall quotient for each task, thus getting a measure of how much each task became more or less salient during the recession and recovery.
(I suggest you click on each graph to see it in a format that is big enough to read easily.)
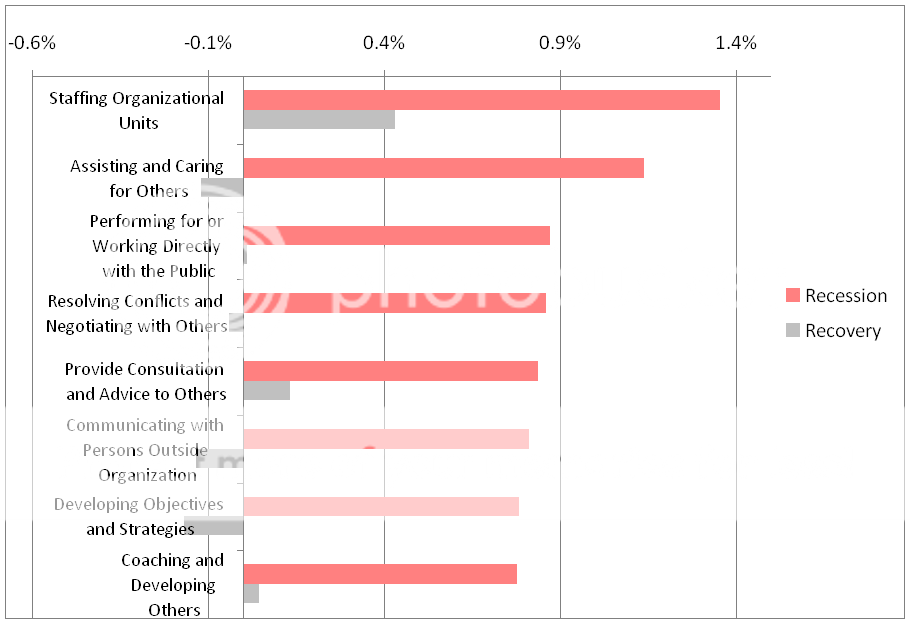
This first graph shows the work tasks that lost the most ground during the recession. Based on the types of tasks that appear here, you can see that this downturn really deserved its nickname “the mancession.” These tasks characterize the manufacturing and construction industries, which were among those hardest-hit by the slump. Note how every one of these tasks bounced back during the recovery, but not enough to make up in two years of recovery for the erosion during the two years of recession.
This first graph shows the work tasks that lost the most ground during the recession. Based on the types of tasks that appear here, you can see that this downturn really deserved its nickname “the mancession.” These tasks characterize the manufacturing and construction industries, which were among those hardest-hit by the slump. Note how every one of these tasks bounced back during the recovery, but not enough to make up in two years of recovery for the erosion during the two years of recession.

But some types of jobs actually gained workers during the
recession, and the second graph shows the work tasks that reflect this. These
work tasks, which gained the most ground during the recession, characterize the
education, health-care, and government jobs that were not fazed by the
downturn. However, half of these tasks proved to be countercyclical—that is,
they slid downward while the economy recovered. And even those that showed
gains during the recovery did not match the gains they made during recession.
Like the recession, the recovery did not affect all kinds of
jobs the same way. Some jobs actually showed a net loss of workers during the
recovery, and the work tasks in the following graph are those that lost the
most ground during this period. Note that every one of these did quite well
during the recession, but they suffered (although not to the same extent) while
the economy as a whole rebounded. These tasks characterize bureaucratic and
clerical jobs, which have been hurt by government cutbacks and by automation.


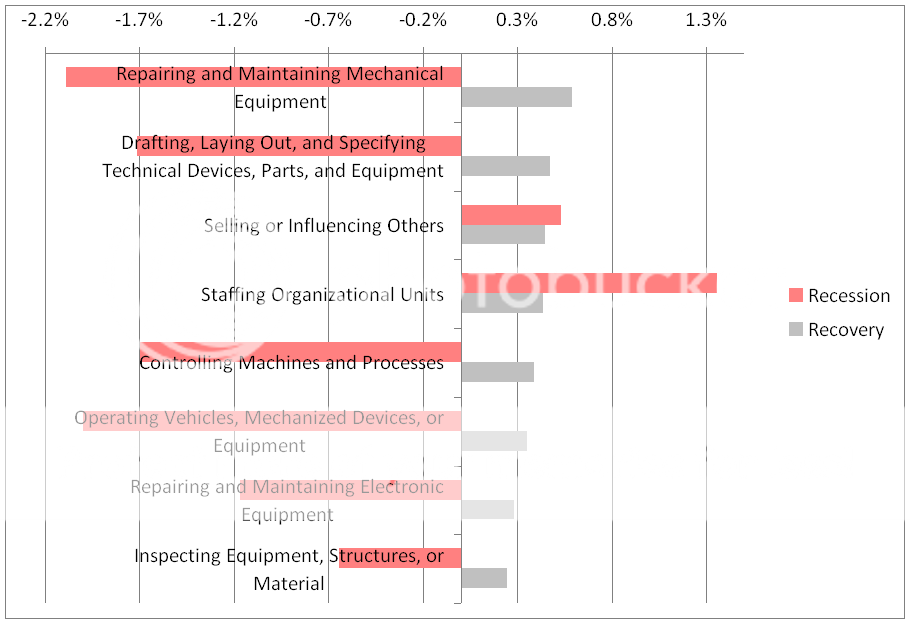
The last graph shows the work tasks that gained the most
ground during the recovery. Many of these tasks appear as “mancession” victims
in the first chart, but two of them characterize white-collar occupations. It’s
especially interesting to note the job security indicated by the steady growth
of work that involves Selling or Influencing Others.


core aeration service troy
ReplyDeleteLooking for a healthy lawn? Core Aeration Service troy, Missouri at the cheapest prices can turn it into a thick, lush and greenest lawn in the city.
to get more - http://troylawncare.com/core-aeration-service-troy/